Retrocasts are tests of a forecasting model using historical data, to ascertain accuracy before the model is used to predict an actual election. The following are the Congress Compass retrocasts for the presidential elections from 2004 to 2016, and for the House elections from 2006 to 2016. Congress Compass’s actual historic forecasts are for the federal elections of 2018 and 2020, whose results can be found on the accuracy page.
Presidential model
The Congress Compass model would have correctly predicted the winner of the four presidential elections from 2004 to 2016. The average statewide error in margin would have been 3.7%, with a correct call rate of 98.0% across 200 statewide contests for presidential electors in these four elections.
2016: Tilt Trump
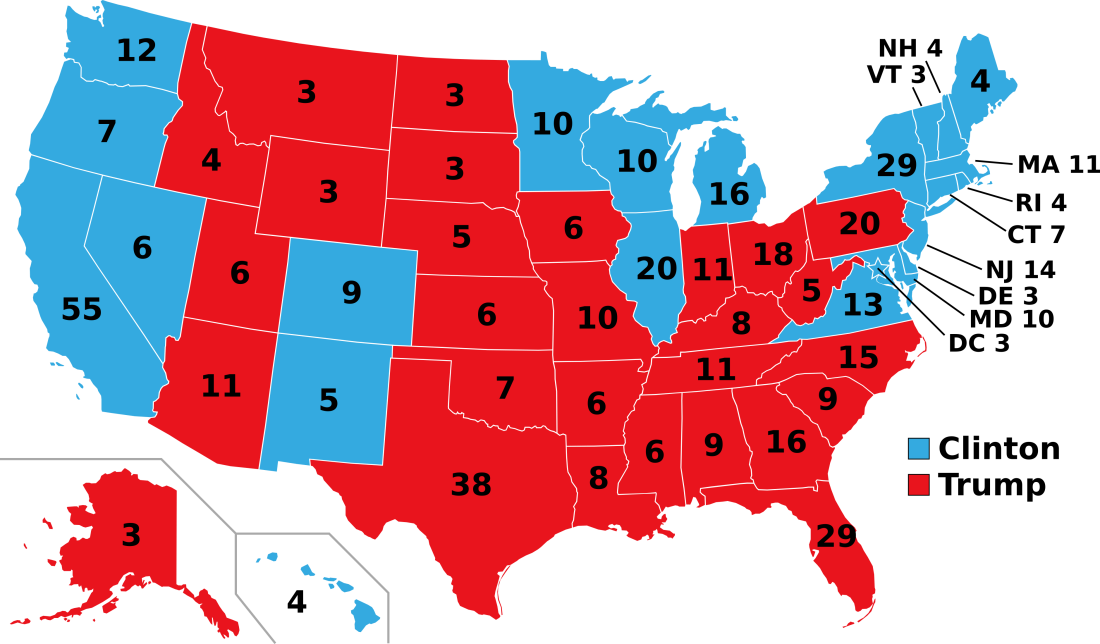
Congress Compass would have been the sole forecaster to predict the correct result of the 2016 presidential election: Republican nominee Donald Trump winning the Electoral College while Democratic nominee and former Secretary of State Hillary Clinton won the popular vote. Congress Compass would have been able to do this because it would have been the only one to predict Pennsylvania would go to Trump, thus giving him the presidency.
2012: Lean Obama

The 2012 presidential forecast would predict then incumbent President Barack Obama as the favorite for re-election. 49 out of 50 states would have also been predicted correctly, with the exception of the Florida, the closest swing state that year.
2008: Likely Obama
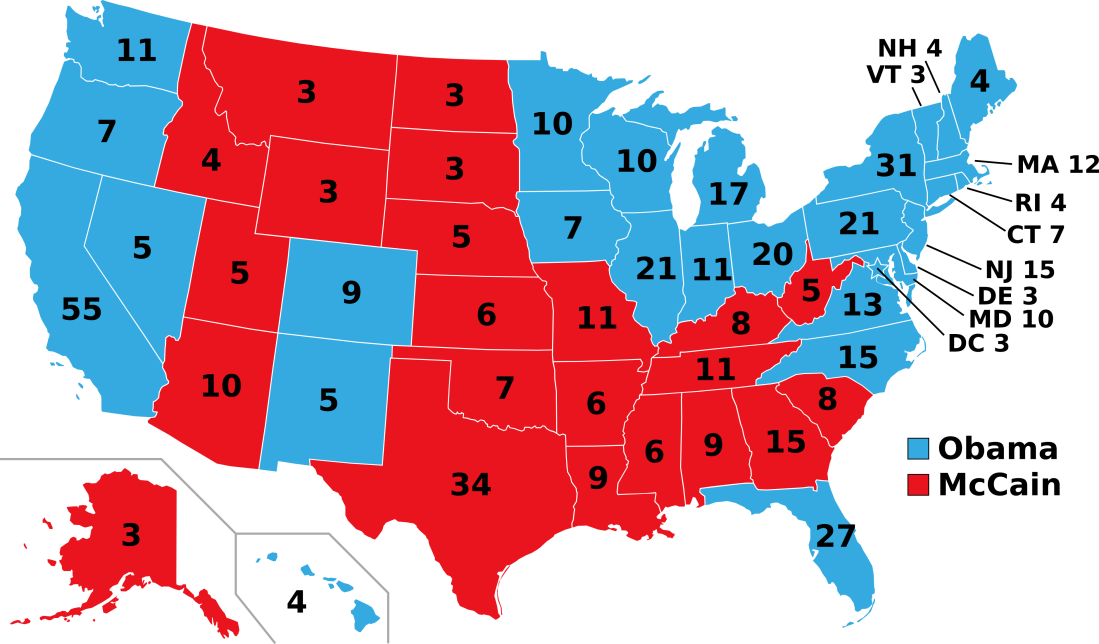
The 2008 presidential forecast would have predicted then Senator Barack Obama as the likely winner of the election. The forecast would have also correctly called the outcome of all 50 statewide races, including Indiana, a state miscalled by both FiveThirtyEight and RealClearPolitics.
2004: Tilt Bush
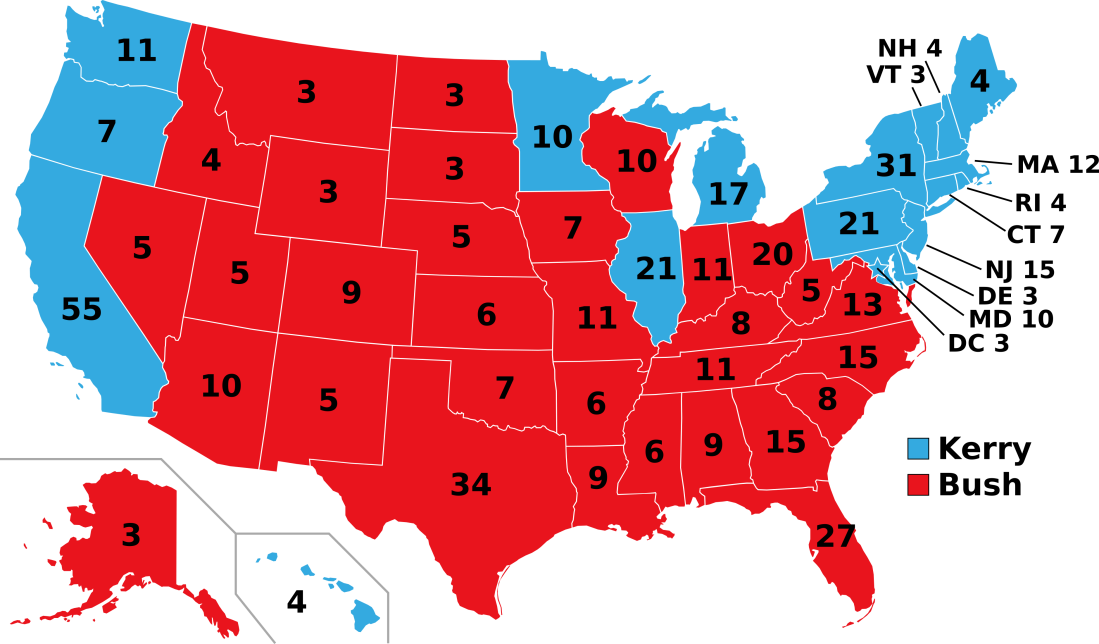
The 2004 presidential forecast would have correctly identified then incumbent President George W. Bush as the slight favorite for re-election. Congress Compass would have correctly called 49 out of 50 states, including two (Iowa and New Mexico) which were decided by less than one percent. The national popular vote margin in the forecast is also less than two-tenths of one percent off from the actual popular vote margin.
Congressional model
The Congress Compass forecast correctly called 96.8 percent (420 of 434) of the certified races for the House of Representatives during the 2018 midterm elections. The race for overall control of the lower chamber was competitive, with 44 races decided by 5 percent or less and 80 races decided by less than 10 percent overall. However, the model correctly predicted 83.8 percent of these competitive races as well.
The forecast succeeded because of the 527 polls used to make it, building on the rigorous work of others done at places such as Siena College and Monmouth University. Workers across the country made millions of phone calls to create district-level polling that proved to be historically accurate, despite the difficulties posed by an electoral cycle with so many competitive races. Without pollsters and the people who work for them, these forecasts would be impossible.

Historical elections
Congress Compass published its first forecast for the 2018 midterm elections, but historical data was used to test its accuracy beforehand. In the two previous election cycles, Congress Compass would have called the most House races correctly of any prognosticator.
In 2016, the model would have correctly predicted 433 out of 435 races, or a success rate of 99.5%. In 2014, this success rate would have been 97.9%. In both instances, Congress Compass would have only been one (2014) to two (2016) seats shy of predicting the exact number of seats each party held in the House. To showcase this, those retroactive forecasts are presented here, and the way that these ratings were determined is detailed in the Methodology page.
The 2016 and 2014 House election forecasts boast the highest success rates the model would have had in the last ten years of data tested.
For all 264 races that the polling model alone would have been able to produce forecasts for since 2006, it would have called 81.1% of them correctly with an average error of 5.27% in the margin between the two leading candidates.
Historical polling data to test the model was gathered from FiveThirtyEight and RealClearPolitics.
